I work just down the block from Google, and I get the sense that it’s devouring me: every time I drive home I’m surrounded by rainbow Google bikes, giant Google buses, Google Street View cars, Google self-driving cars. But I still haven’t managed to get what I actually want: their data.
Recently, however, I found a way to combine the 23andMe and Google datasets and thus achieve absolute power increase my faith in 23andMe’s dataset. We describe the work on 23andMe’s blog here. It relies on a tool called Google Correlate, which was used, among other things, to build Google Flu Trends: basically, Google Correlate lets you enter a number for every state and see which search terms show the strongest correlation with that state-by-state pattern. For example, when I enter the average latitude for each state, I see that the search terms which are most frequent in Northern states are those you would expect: “how much vitamin D”, “heated seats”, “seasonal affective disorder”, etc.
You can do this with 23andMe data: we know where many of our customers live, and we have their answers to thousands of survey questions, and this allowed me to make maps for more than 1,500 health and behavioral traits. I put the data behind those maps into Google Correlate. I started with 23andMe customer answers to “How often do you eat leafy greens?”, and out of the billions of Google searches, one of the most strongly associated was “raw kale”. States with high rates of 23andMe customers with coronary artery disease also had high rates of Google searches for “statin drugs”, which lower cholesterol. Just as striking were the negative correlations.
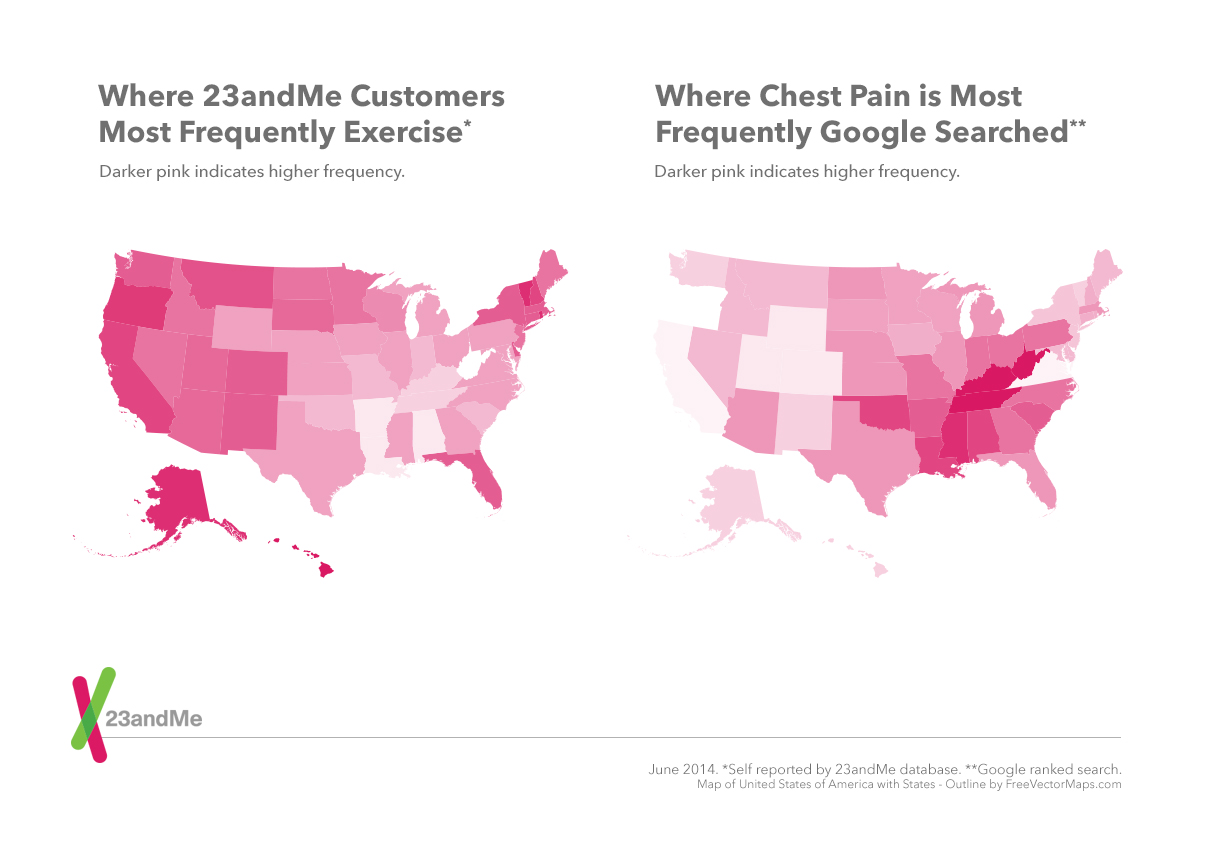
The inverse pattern is clear (and highly statistically significant, even after multiple hypothesis correction). These connections are fun and surprising, given the billions of Google searches, the thousands of 23andMe traits, and the fact that typing in a Google query is very different than answering a medical survey. But I want to talk about a larger point here, which is how we can combine multiple datasets to overcome bias, the specter that haunts my data-related dreams.
By bias I mean “something that makes the number you’re estimating different from the number you want to estimate, no matter how much data you get”. Let’s say you’re trying to figure out whether there’s a difference in physical attractiveness between chessplayers and non-chessplayers. (Yes.) So you go on a dating website with a lot of chessplayers (checkmates.com) and you download all the pictures and you write an algorithm which evaluates the attractiveness of a picture and you compare the algorithm’s output for chessplayers and non-chessplayers. You find that your algorithm says that chessplayers are on average 15% more attractive. You should immediately worry about two things. First, is that difference statistically significant? If you only looked at 4 chessplayers, and one guy was egregiously ugly, it’s probably not. But statistical significance is usually the easy problem, because it can be solved by getting more data; that’s hard if you’re trying to recruit, say, people with a rare psychiatric condition, but I work with datasets which are large enough that statistical significance is rarely an issue. Any difference large enough to care about has like a chance in a trillion of being due to chance.
But bias is a much more insidious problem, because it cannot be solved by getting more data. Here are some biases we might see in the chessplayer problem:
a) Maybe chessplayers who post photos online are more attractive than the average chessplayer.
b) Maybe chessplayers who engage in online dating at all are more attractive than the average chessplayer.
c) An algorithm that measures attractiveness? Really? I’m not a computer vision expert, but I’d be immediately worried that the algorithm was being biased by differences that had nothing to do with the faces. Maybe chessplayers tend to pose with chessboards, and that creates a tiny discrepancy in how the algorithm evaluates them.
In all of these cases, bias means that what you’re trying to measure -- the difference in attractiveness between chessplayers and non-chessplayers in the general population -- is not what you’re actually measuring. More data will not fix bias, because you’ll always be measuring the wrong thing.
We can think of these two problems -- statistical significance and bias -- in terms of romantic pursuits. A statistical significance problem is like when you ask someone out and they say, “I’m sorry, but I just don’t know you well enough yet” -- they need more data. But a bias problem is when they say, “I’m sorry, but I just don’t like you” -- no matter how much more of you they get, you’re still not going to be what they want [1].
I’m now being accused of being frivolous, so here are two more important examples. Why do we care about low voter turnout? It isn’t because we don’t have enough votes to detect a statistically significant difference between candidates. Even in a very close election -- 51 - 49, say, which even in the 2000 presidential race occurred in only 6 states -- the difference will be statistically significant (p < .05) even if only 10,000 people turn out to vote. We worry about low voter turnout because it often produces bias: those who vote have higher incomes, are better educated, are less likely to be minorities, etc. (There are rare cases where the election is so close that the difference actually isn’t statistically significant -- not to start a flame war, but in Florida in 2000, Bush would’ve had to win by about 5,000 votes, not the 537 he actually won by. Even then we might’ve worried about bias due to irregularities in the election process -- but luckily we can all sleep soundly thanks to the completely non-partisan Supreme Court decision.) I think if you actually wanted to measure who the country really wants to be in charge, you would just contact a small randomized sample of people in each state and not let anyone else vote; that would better deal with the bias problem.
Let’s take an example which is less likely to get me mean emails: developing a blood test to detect cancer while it’s still treatable. A lot of people have tried to do this, and pretty much the same thing always happens: they write a paper saying that you can detect cancer X by looking at the levels of molecule Y, everyone gets excited, other people try to replicate the results and they never can. The most plausible reason for this is that the original results were due to bias. What you want is a blood test that can tell the difference between apparently healthy people who secretly have cancer and apparently healthy people without cancer. But apparently healthy people who secretly have cancer are hard to find, because most cancers are rare, so you would have to take blood from a lot of healthy people -- hundreds of thousands, in some cases. So most scientists use a shortcut: rather than taking blood from apparently healthy people with cancer, they just take blood from people with cancer. Those people are easy to find: you just go to a hospital. Unfortunately, this means you haven’t designed a blood test that can detect cancer in apparently healthy people -- you’ve designed a blood test that can detect cancer in people we already know have cancer at your particular hospital. Which is fine, if these two groups have the same blood -- but often they don’t. For example, cancer treatment itself messes with your blood -- blood samples may be collected while the patient is under anesthesia, or undergoing chemotherapy, which both alter your blood. So you haven’t created a cancer detector; you’ve created a chemotherapy detector. Or maybe your cancer and healthy populations are different for reasons you don’t care about -- one attempt to develop a screen for prostate cancer compared cancer patients (who were all men) to healthy controls (who were all women). So then you’ve created a sex detector.
Summary: bias undermines democracy and kills people. What do we do about it? There are standard practices for reducing bias -- controlling for obvious things like sex, doing double-blind studies so your results aren’t influenced by what you want to see. But I still tend to be very nervous about bias, in part because I’m a nervous person and in part because everything is intercorrelated, so tiny discrepancies in variables you don’t care about can produce discrepancies in variables you do. Another powerful means of determining whether a pattern is due to bias is to see if you see the pattern in a very different dataset. Because while both datasets likely have biases, they’re unlikely to be the same biases: so if you see the same pattern in both, it’s more likely to be due to something real. To return to 23andMe and Google, 23andMe survey results are probably biased by the fact that 23andMe customers aren’t necessarily a representative sample of the general population. Google is going to suffer less from this, since its product is more pervasive, but might be biased by the fact that Google searches map only weakly onto what someone is actually thinking. (For example, if more people Google “I want to have sex with sheep” than “I want to have sex with my girlfriend”, that might not be because more people want to have sex with sheep than with their girlfriend; it might be because they’re freaked out about the sheep, and turn to Google.) Both datasets are going to be biased by the fact that you have to be able to use a computer to use Google or enter 23andMe survey answers, but this is a considerably less scary bias than the ones in the independent analyses.
Obviously, the 23andMe/Google analysis is more of a fun proof-of-concept than a rigorous statistical analysis, but the compare-multiple-datasets idea is an important one. To return to biomedical research: often preliminary analysis will be done on a sample from one hospital, and the results will then be checked on a sample from another hospital; this controls for hospital-specific biases. Or you might do analysis on a dataset of a completely different nature: here’s a lovely analysis that starts by looking at gene expression data over time, draws some conclusions, then investigates whether those conclusions are true by actually knocking out some of the genes and analyzing that dataset as well, and compares these results to another dataset that used another method to analyze the genes.
I’m not saying that every study that uses a single dataset is biased or unpublishable -- clearly that isn’t true. But attempting to replicate results in a different dataset is almost always worthwhile, because anticipating every bias is impossible. This is particularly true if you’re generically curious, like I am, and you’re often poking your nose into fields in which you have no business or background knowledge.
Notes:
[1] In practice, I suspect many people who say the former actually mean the latter, but that is not applicable to our analogy.
So what's your opinion on repeatability and reproducibility? There's a strong movement in CS (especially in the systems domain) toward repeatability -- publishing code online, making data sets available, and having the scripts you used to run your analysis out in the open. I think this is generally great, but one thing that does concern me is this: if someone wants to reproduce your results and they have what you reported in your paper to go on, is it more likely that they will find biases like confounding variables, unintentional stratification, etc.? Reproducibility is threatened by many things: a paucity of data sets, errors in code, small changes in implementation (not all RNGs and statistical packages are created equal). Do you think there exists a "sweet spot" between providing enough information to reproduce and providing too much, thus potentially biasing colleagues into making the same mistakes/assumptions?
ReplyDeleteThis is an interesting point and I've been thinking about it for a few days. From my limited experience writing/reading papers, I think you should try to make your analyses as reproducible as possible. Yes, this might lead some people to reproduce your errors and biases. On the other hand:
Delete1. At least if you show them exactly what you did, they can _find_ those errors and biases. If you give them a vague description of what you did, they're more likely to just assume it was okay, when often it isn't.
2. Giving them your exact methodology doesn't prevent them from tinkering with it to see how fragile your results are. One very natural way this happens is: someone tries to use your method on another dataset.
3. People are lazy, or at least I am. I'm a lot more likely to use and explore a method if the author's provided code with which I can reproduce it as opposed to a recipe which might take hundreds or thousands of lines to implement.
4. I think the argument against providing a complete description of a method is too easily used as a rationalization -- there's already a lot of pressure to conceal messy results, but science is messy, and we don't need more of that.
That said, there are a lot of pragmatic reasons analyses are often not completely reproducible -- maybe you can't provide the full data for privacy reasons, for example. So I think as long as the author's made a good-faith effort to make their work reasonably transparent, I'm probably okay with that. Hopefully this is salient to your very interesting point! What do you think?
How do you detect bias in your results? Since it is not always feasible to collect entirely different datasets, is there a way to overcome biased results using only the available dataset? Lastly, is it possible to quantify the level of bias?
ReplyDeleteIn general, it is not possible to quantify the level of bias in the results. For example, let's say I'm trying to measure the height difference between men and women, so I recruit a bunch of people and measure them -- but then I learn the men are all pygmies from the island of Ooglyboogly, where people have been unusually short for 13 generations. Obviously that's going to mess up my results, but I don't really have any idea of _how_ much it's messing them up, because I haven't collected any data about other men. Maybe under some circumstances, I can try to estimate just how skewed my dataset is -- I find a research paper telling me that men from Ooglyboogly are 3 inches shorter than the average man -- but this will rely on assumptions or external data.
DeleteDetecting bias is easier. Here are some ways I do it:
1. Common sense. For example, I don't need to do a detailed statistical test on 23andMe data to know that anyone who pays $99 (or $399) for a genetic test is going to be on average an unusual member of the population, and that my results may not generalize to the full population.
2. Seeing weirdly strong effects that are non-concordant with previous literature or don't make sense. If you see some huge signal in your data, and there's no apparent reason for the signal, I'd be very suspicious that something weird is going on.
3. Talking to experts about the biases that may be in your dataset. I'm working on a paper at the moment about genetic networks and we saw some weird link between the lungs and the blood. Talked to an expert on the data, turns out the samples from the lung might have had blood in them.
Hope this helps! Let me know if you have good bias-fighting tips.
Ah. Perhaps a fourth method for detecting bias -- compare the basic statistics of your dataset to one known to be unbiased. For example, I can take the average age or income of 23andMe customers and compare that to the average age or income in the US census. If there are big gaps, I know I'm dealing with an unusual population, which may introduce bias.
DeleteAnybody can achieve more from this blog. As my father was a victim of Cancer, i really fell your content from the depth of heart. Great arrangement like breast cancer
ReplyDeleteExamine this blog https://collegepapers.co.uk/blog/research-paper-introduction for even more tips on research paper writing.
ReplyDeletegoogle 2352
ReplyDeletegoogle 2353
google 2354
google 2355
google 2356