Correlation matrices are like the lover you just can’t let go: complex and deceitful, but too irresistibly fascinating to abandon. A year ago, when they made me crash Stanford’s supercomputer for the third time, I almost swore them off forever. But I’ve been flirting with them frequently in the past few weeks, and I’d like to write about our reconciliation. First I'll describe what they are; then I'll give five cool examples of why they're useful.
What's a correlation matrix? It’s a square table that describes how variables go up or down together. Here’s an example:
Snowy Outside
|
Wear a Sweater
|
Snuggle by Fire
| |
Snowy Outside
|
-
|
.8
|
.7
|
Wear a Sweater
|
.8
|
-
|
.2
|
Snuggle by Fire
|
.7
|
.2
|
-
|
Each entry in the table is the correlation between two variables, a number between -1 and 1 where positive correlations mean that when one variable goes up, the other one tends to as well; negative correlations mean that when one variable goes up, the other tends to go down. In the example above, snow and sweaters are strongly correlated, and snow and snuggling are too, but sweaters and snuggling are less strongly correlated. (Usually I get too warm when snuggled in a sweater, and am less inclined to snuggle the sweatered as well.)
This is useful because it lets us rapidly see how groups of variables are related and pick out variables that are connected. Here are five brief examples which I may write about in more detail later -- click on the links, the pictures are cool.
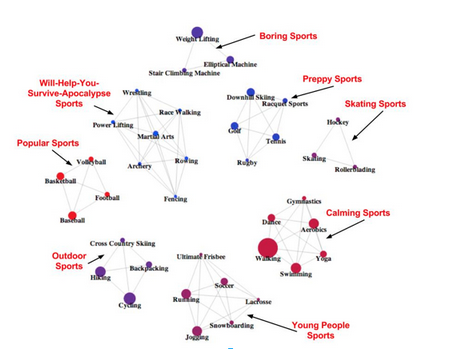
-We can look at the 23andMe customers who play 39 different sports, and compute the correlations between sports (full post, in honor of the Olympics, here), and divide sports into groups that tended to be correlated. This lets you see groups of sports that tend to be played by the same people: preppy sports, boring sports, lethal sports, etc.
- We can compute correlations between flavors or ingredients in cocktails, which lets you see which ingredients and flavors tend to be used together, and potentially invent your own cocktails. Here are flavors:

- We can look at the commenters on different New York Times forums, which shows you which New York Times forums tend to share commenters -- the female-dominated forums about fashion, health, and parenting, for example.
- We can look at how levels of gene expression covary in the human body, which can reveal groups of genes that work together: here’s a cluster with immune functions within the blood. (The full tool I built is here.)
- We can compute the correlation matrix for 500 last statements of Death Row inmates (thank you, Texas) where our variables are things like mentioning family or expressing anger:
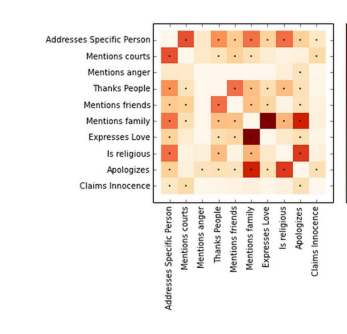
The darker a square is, the more strongly two variables are correlated: the strongest correlation is between mentioning family and expressing love, which should make you maybe think twice about the people we’re executing.
So one technique can lend insights into everything from alcohol to execution. Amazing, right? What’s the catch? There are at least three problems with correlation matrices [1]:
1. They can lie to you. In the snow example given above, it’s possible that wearing a sweater actually causes you to be less likely to snuggle, all else being equal, but the correlation still appears positive because wearing a sweater is a sign that it’s cold, which is the true cause of snuggling.
2. They can be too big. If I have 10,000 variables, I’m going to need a table that’s 10,000 x 10,000, which is how I crashed Stanford’s supercomputer (I was trying to compute correlations for 10,000 genes in 35 different tissues simultaneously.) This isn’t just a problem because you crash your computer: it’s also because when you compute a table that’s 10,000 by 10,000, you’re computing the values of 50,000,000 variables, and to do that accurately, you need a lot of samples, which you often don’t have. That means that you can’t really trust the values you compute.
3. They can produce knots that are hard to untie. My sports example makes it look like there are eight beautiful groups of sports that separate perfectly:
But of course that isn’t really the case: all the sports are somewhat correlated, it’s not like no one who skis plays baseball. But if you actually drew all those correlations, you’d end up with a giant hairball. For example, when I finally got the Stanford supercomputer to compute covariance matrices for my genes, here’s what I found the BRCA1 (breast cancer) gene tended to covary with in breast tissue:
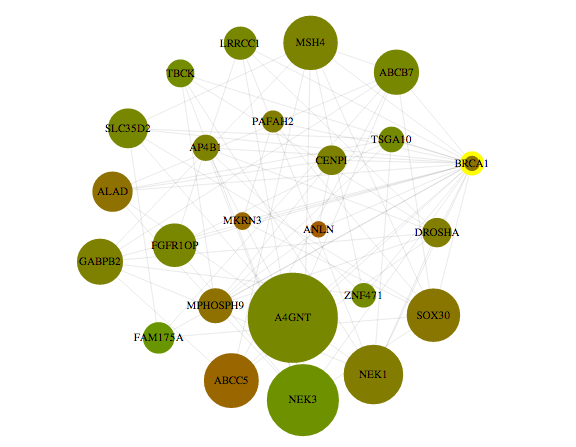
There are 24 genes here with hundreds of links, and it’s very unclear how to make sense of them. To deal with this problem we often try to reduce the number of links, either by ignoring links unless the correlation is very strong or by using more sophisticated techniques.
Notes: [1] All of which have analogues in love.


This comment has been removed by a blog administrator.
ReplyDelete업무 후 지친 몸을 편안하게 관리받을 수 있어 만족했습니다. 용인출장마사지는 용인출장마사지 세심한 진행과 친절한 서비스가 특히 인상적이었습니다.
ReplyDelete원하는 조건과 생활 패턴을 고려한 일자리 탐색은 중요하며, 밤알바 정보를 확인하면 다양한 근무 형태와 장점을 비교할 수 있어 효율적인 선택과 계획 수립에 도움이 됩니다.
ReplyDelete남아 있는 상품권을 효율적으로 활용할 수 있는 방법으로 관심이 높습니다. 상품권매입 서비스는 안정적인 운영과 편리한 상담을 제공해 시간 절약과 쉬운 관리라는 장점을 함께 제공합니다.
ReplyDelete서비스의 장점은 쉬운 접근성과 높은 활용도라고 생각합니다. 상품권할인 통해 필요한 상품을 보다 경제적으로 준비할 수 있었고, 실용적인 혜택 덕분에 소비 만족도가 더욱 높아졌습니다.
ReplyDelete온라인에서 발생하는 소액 거래를 효율적으로 관리하려면 자신에게 맞는 결제 방법을 알아두는 것이 좋습니다. 소액결제 다양한 디지털 콘텐츠와 서비스에서 활용할 수 있으며 결제 내역을 확인하면 지출 관리에도 도움이 됩니다.
ReplyDelete집에서 편안하게 쉬는 것을 선호하는 편이라 원하는 장소에서 이용할 수 있다는 점이 특히 좋았습니다. 출장마사지 이동에 따른 피로를 줄여주고 여유로운 공간에서 휴식할 수 있어 편안했습니다. 일정이 바쁘거나 외출을 줄이고 싶은 날에도 시간을 효율적으로 활용할 수 있다는 점이 장점입니다.
ReplyDelete갑자기 일정이 많아져 몸이 무거운 날에도 편하게 이용할 수 있어서 만족스러웠습니다. 출장마사지 장소 이동 없이 원하는 시간에 관리받을 수 있어 시간 활용이 효율적입니다. 긴장된 부위를 부드럽게 풀어주면서 편안한 상태를 만들어 주는 느낌이었고, 관리가 끝난 뒤에도 여유롭게 휴식을 이어갈 수 있다는 점이 특히 좋았습니다.
ReplyDelete상품권을 효율적으로 처리하고 싶을 때는 조건이 명확한 서비스를 찾는 것이 중요합니다. 상품권매입 방법을 알아보면서 업체별 수수료와 정산 방식, 이용 절차를 비교하면 불필요한 비용을 줄이는 데 도움이 될 수 있으며, 개인정보 보호와 안전한 거래 절차를 제공하는지 확인하는 것도 좋은 선택 기준입니다.
ReplyDelete여행이나 외부 활동을 많이 한 날에는 몸이 쉽게 지치는데 편안하게 휴식을 취하면서 관리받을 수 있어 좋았습니다. 오산출장마사지는 익숙한 공간에서 이용할 수 있어 부담이 적고 이동 시간을 절약할 수 있다는 장점이 있습니다. 오산출장마사지 뻐근한 부위를 부드럽게 관리해 긴장감을 완화하는 데 도움이 되었으며, 활동 후 몸을 정돈하고 재충전하기에 유용했습니다.
ReplyDelete시간 활용이 중요한 분들에게 유연한 근무 형태와 일정 조정의 편의성을 갖춘 일자리는 좋은 선택지가 될 수 있습니다. 밤알바 관련 정보를 살펴보면 자신의 생활 패턴에 맞는 조건을 비교하기 쉬워지고, 원하는 시간대와 업무 환경을 신중하게 확인하는 데도 도움이 됩니다. 근무 전 조건과 급여, 업무 내용을 꼼꼼히 확인하면 보다 안정적으로 계획을 세울 수 있다는 점도 장점입니다.
ReplyDeleteThis comment has been removed by the author.
ReplyDelete밤알바 플랫폼이 제공하는 보안 시밤알바 스템과 프라이버시 보호 기능은 구직자들이 안심하고 활동할 수 있는 기반이 됩니다. 개인정보 보호 조치가 잘 마련된 곳을 우선적으로 고려해야 합니다.
ReplyDelete하루의 피로가 많이 쌓인 날에는 무리하게 움직이기보다 편안하게 쉬는 시간이 필요한데 출장마사지 그런 상황에 잘 맞았습니다. 원하는 장소에서 편하게 관리받을 수 있어 이동 부담이 없었고, 긴장된 근육을 부드럽게 관리하면서 몸과 마음을 차분하게 쉬게 할 수 있어 좋았습니다.
ReplyDelete바쁜 하루를 보낸 뒤 가까운 곳에서 편하게 이용할 수 있는 서비스를 찾는 경우가 있습니다. 수원출장마사지 업체를 선택할 때는 방문 가능 지역과 예약 시간, 관리 프로그램을 미리 확인하고 본인의 이용 목적에 맞는지 살펴보는 것이 좋습니다.
ReplyDelete상품권 관련 서비스를 이용할 때는상품권매입 단순히 편리함만 보는 것보다 거래 과정과 조건을 함께 확인해야 한다고 생각합니다. 상품권매입 내용을 살펴보니 상품권 종류별 조건과 절차를 확인하는 것이 필요했고, 수수료와 처리 기준까지 비교할 수 있어 실제 이용을 준비하는 데 참고하기 좋은 정보였습니다.
ReplyDelete