My master’s thesis, which I spent most of this year working on with my supervisor, Chris Yau, contains 83 pages, 82 equations, and 13,000 lines of code, but because you are brilliant I am going to explain it here in 800 words (plus one 300-word note on what I learned from the project) and you are going to understand all of it.
The thesis develops better ways of performing two important statistical tasks on a widely used type of biological data. First I’ll explain the data, then I’ll explain the tasks, then I’ll explain what we did.
The data is called single-cell gene expression data. In a previous post I explained why we like gene expression data: it tells us how much RNA cells produce from their genes, which tells us which genes are important to the cell’s functions.
Before, we could only measure gene expression data by combining hundreds of cells: otherwise there wasn’t enough RNA to measure. But single-cell gene expression data lets us measure RNA levels within single cells. This is exciting because rather than pretending that all the cells in a tissue, or a tumor, are identical, we can look for groups of cells which are different in important ways. It’s like the difference between asking “What are Americans like on average?” and interviewing individual Americans. (We’re not all bad!)
These differences between cells matter because they have implications for how we treat disease. For example, single-cell analysis reveals that brain tumors which are classified as a single type in fact contain mixtures of multiple types of cells. And this diversity makes the tumors harder to treat: the more diverse the tumor is, the worse the patient’s prognosis, possibly because treatments that work on one group of cells don’t work well on the rest of the cells.
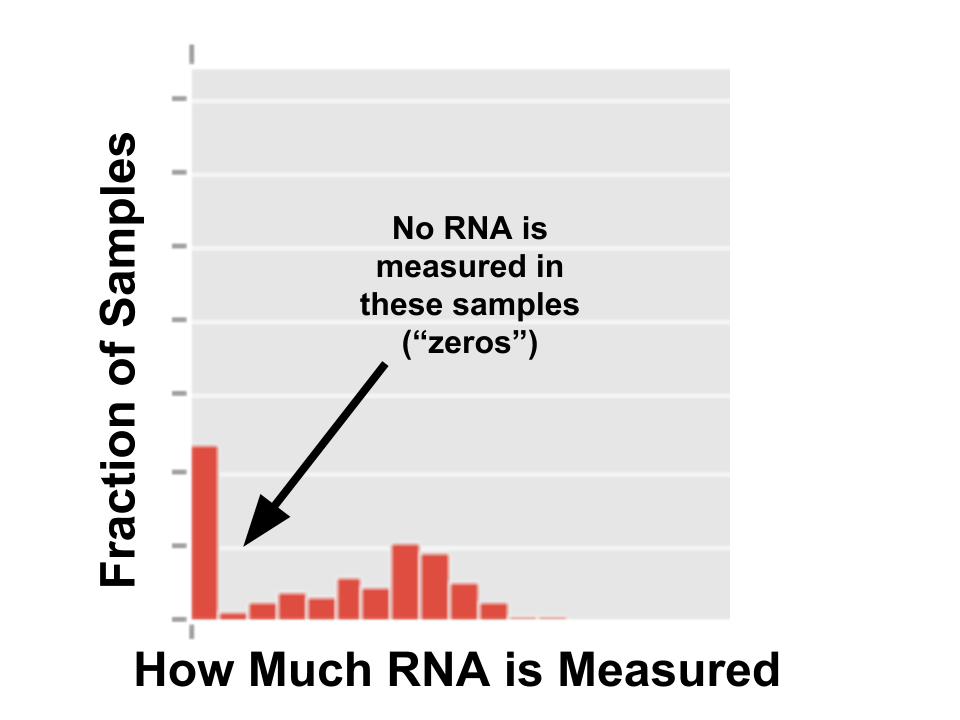
So people are writing papers saying single-cell data will “revolutionize” science. (I would write papers saying things like that, but no one pays attention to me.) Unfortunately, single-cell data is also hard for standard statistical models to deal with, because it has a lot of “zeros”: cells where we cannot detect any RNA produced from a gene. If you plot how much RNA is measured from a gene, it looks like this:
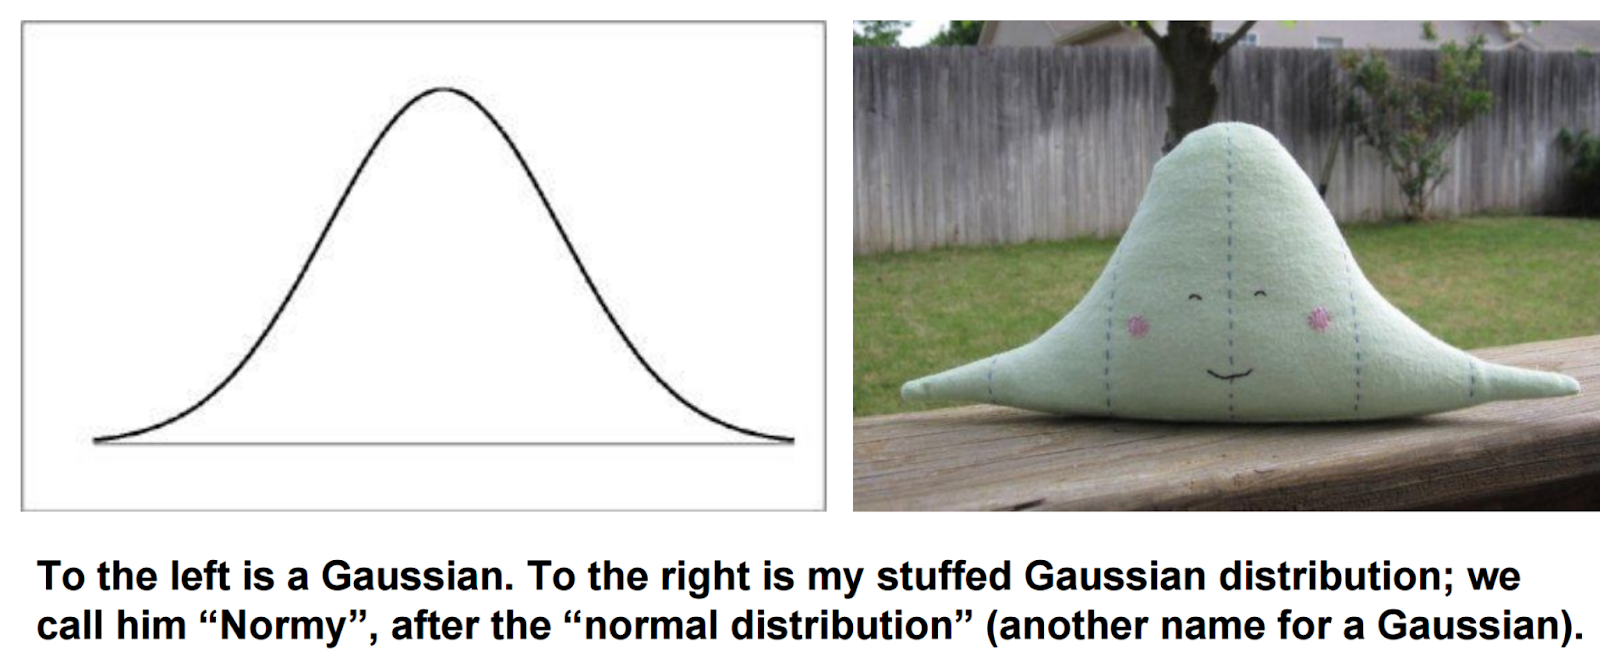
The spike at zero is bad because many statistical models assume data is Gaussian -- that is, it makes a nice blob, pictured below.
Obviously, the spike at zero in single-cell data makes the data very not Gaussian, and this makes it harder to perform many statistical tasks. Specifically, there are two things we often want to do with data -- cluster it, where we divide cells into groups so that similar cells are put into the same group, and reduce its dimension, where we plot cells in two (or more) dimensions such that similar cells appear close together [1]. Standard methods for performing these tasks assume the data is Gaussian.
In my thesis, we first develop a model for the patterns of zeros in single-cell data, and, based on this model, show that zeros really do hurt the performance of standard methods. We show, in several different datasets, that genes that are expressed at a higher level are less likely to be zero, and develop a model that describes this relationship. (I describe the mathematical details here [2].) Based on our model, we generate simulated data and show that the performance of standard statistical methods gets worse as we add zeros. Here’s a demo: move the slider to add zeros, and watch how the clusters (which are supposed to be separate) get mushed together. This is bad. We have an important new type of data; we have important statistical tasks that we often want to perform; standard methods for performing the tasks do not work well on the new data.
Diagnosing the problem is easy; how do we fix it? We develop two new models: a clustering model (ZIMM, for zero-inflated mixture model) and a dimensionality-reduction model (ZIFA, for zero-inflated factor analysis -- new statistical models are required to have a cool acronym). I give more details on how we developed the models in this footnote [3]. We show that our models do a better job than standard models on both simulated data and real biological data and put the code online so other people can use them. We are giving talks on the work at various venues, and a paper is under review. If you’re interested in using or extending these models, feel free to send me or Chris an email.
While we developed these models for single-cell data, they are potentially useful for lots of other datasets which have many zeros or missing datapoints. In the thesis we discuss several examples: recommendation datasets (how much will a person will like a product? -- see, for example, Netflix’s million dollar competition to predict movie ratings), usage datasets (how often a person will use a product?) and network datasets (how strongly are two nodes, eg airports, connected in a network?) Feel free to read the last chapter of the thesis and let me know if you have ideas for further applications (translation: do my homework for me).
Working on this project taught me about the role of luck in research. I often feel there’s a great deal of luck when you investigate some cool statistical hypothesis (“older women with cats are more likely to be single”). The hypothesis may or may not turn out to be true, but its truth doesn’t depend on how good a scientist you are. This luck evens out, though, because better scientists a) look at more things b) look at more interesting things c) look at them more rigorously.
You might think, though, that when you’re just doing math rather than observing the world, there’s no luck involved, only skill; equations are within your control. Still, my experience this year makes me feel there’s still luck involved, and I’ll draw an analogy to chess. Chess, in theory, is a game with no luck; there’s no dice, no drawn cards. But you will still hear chess players say “I got lucky” (or, more often, “I got unlucky”) because they calculated ten moves ahead, and on the eleventh move, their queen happened to be in the right place, and so they won, but they didn’t foresee it.
Similarly, my thesis involves about ten pages of algebra, at the end of which the math works out nicely. But I didn’t know this would happen when I began; this is what I mean by getting lucky.
Again, though, I feel the luck evens out here. I may occasionally beat a chessplayer who sees farther ahead than me because my pieces end up in the right place, but most of the time I’m going to lose. Similarly, I have met mathematicians who can see further down a proof tree than I can (and also have an eerie instinct for which branches will yield fruit) and they can prove trickier things than I can. In the case of my thesis, while we got “lucky” in the end, we also had to fix my screwups revise our approach several times; the final product feels like the result of a lot of blood, sweat, and tea [4]. Or maybe I’m just saying that so Oxford will let me graduate.
Notes:
[1] For each cell, we have data for tens of thousands of genes. It’s very hard to visualize or analyze data with ten thousand dimensions. So we want to reduce ten thousand to something more manageable, like two, in a way that preserves basic patterns in the data.
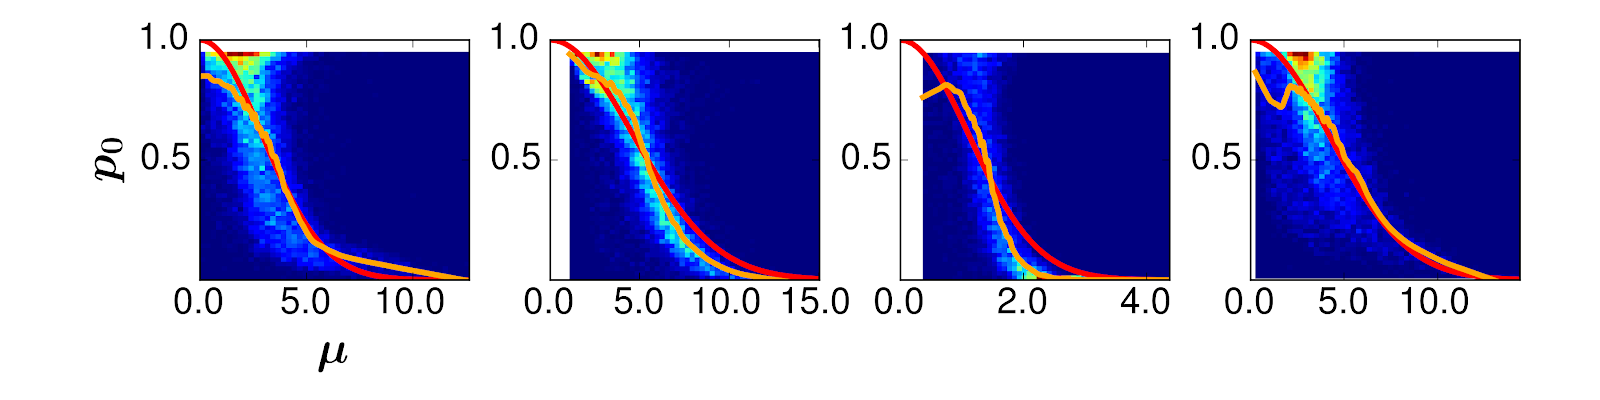
[2] Call the probability that a gene is zero p0, and the average expression of a gene when it’s not zero μ. Then, p0 = exp(-lambda*μ2), where exp is the exponential function and lambda is a parameter we fit to the data. Here are four different real biological datasets: the orange line is the actual data, and the red is our fitted model. You can see the orange line fits the red line pretty closely.
[3] Here’s a two-step procedure for developing statistical models:
- Write down (using math) the process you think generates the data. This is usually the straightforward part. In the case of ZIFA and ZIMM, our process is “generate data using a standard statistical model. Then, add zeros to that data”.
- Your model will have “parameters” -- numbers that affect the predictions it makes. For example, if your model is
number_of_colleges_you_get_into = A*your_SAT_score + B*your_parents’_income
then A and B are parameters of the model. Obviously, in order to calculate useful things with a model (in this case, how many colleges you are expected to get into) you need a way of figuring out the values of the parameters (for example, A = .01, B = .001). This is the hard part; it took me most of the winter.
[4] The British do not cry, or if they do, they cry Earl Grey.
very informative blog and useful article thank you for sharing with us , keep posting Data Science online Course
ReplyDeleteso informative, What an Excellent post.It is the thing that I was looking for. I might want to propose you that please continue sharing such sort of information. Much appreciated. We also share a post on Relevant Education. For any assistance talk to us or call us:
ReplyDelete91 8471058750,91 8527239575
cbse coaching in Noida
medical entrance coaching in noida
engineering classes
commerce & science classes in noida
Please visit our blog: relevanthometutors.blogspot.com
This comment has been removed by the author.
ReplyDeletevery amazing photos and content you publish.we also post on Earn unlimited money online at legit paying site by * Listening * Watching * Liking
ReplyDeleteVideos,photos
ReplyDeleteThankx for sharing a wonderful post.
We offers an incredible training program in the field of German Language Training,Carrer Counselling,Test Peparation..
Geography Assignment Help UK
ReplyDeleteEconomics Assignment Help
TreatAssignmentHelp - An Assignment Writing Company in UK
Treat Assignment Help By GeorgiaStewart
Treat Assignment Help By AnaGibson
Online Assignment Help UK
Assignment Writing Services
Treat Assignment Help
Assignment Writing Services
This particular is usually apparently essential and moreover outstanding truth along with for sure fair-minded and moreover admittedly useful My business is looking to find in advance designed for this specific useful stuffs… jersey sofa cover , fancy bed sheets price in pakistan
ReplyDeleteCrafted for the sole purpose of General knowledge, News about the World, People, Universe, Animals, Health tips, Science, Weird news, Biography, Travel, news online
ReplyDeletedownload Mobile తాజా తెలుగు వార్తలు, download teugu news mobile app. Get the lastest telugu Live news, telugu breaking news, Live news telugu, online telugu news Telugu News app Local telugu news, Eeroju varthalu
ReplyDelete"GK Questions Check GK Questions Answers (General Knowledge Quiz), General Studies / General Awareness for various competitive exams schools, college, Jobs, Technical
ReplyDelete"
Our Texas medical billing services can make your practice more profitable by increasing incoming payments. There are no hidden costs or additional charges - Medical Billing Company in Texas
ReplyDeletegoogle 3613
ReplyDeletegoogle 3614
google 3615
google 3616
google 3617
I want to testify on how I got cured from Herpes. I have been living with this disease for the past 11 months, i have done all i can to cure this disease but all my efforts proved abortive until i met an old friend of mine who told me about a herbal doctor called Dr Oniha, she told me that Dr Oniha have cure for all kinds of diseases, though i never believed in it because my believe was that there is no cure for Herpes disease. But I decided to give it a try when I contacted Dr Oniha, he told me he has a cure for herpes that he cured with herbal medicine. I order for the herbal medicine, which Dr Oniha sent to me through a courier service which i make use of and now behold the herpes is gone and i now have my life back,if you are out there living with this disease i will like you to also contact Dr Oniha and get this disease cured out of your body. I am a living testimony of Dr Oniha herbal cure. Thanks once again Dr Oniha for you are God sent. contact Dr oniha through his contact information.
ReplyDeleteEmail:driyaseherblahoe@gmail.com
Whatsapp number: +2347057052206
Pretty! This was an extremely wonderful post. Thank you for providing this info
ReplyDelete메이저사이트
온라인경마
Wonderful, what a blog it is! This weblog gives useful facts to us, keep it up.
ReplyDelete바카라사이트
메이저사이트
كشف تسربات المياه
ReplyDeleteعزل اسطح
تسليك مجاري
مكافحة حشرات
شركة لمسات الابداع
서울출장샵
ReplyDelete광주출장샵
광주출장샵
인천출장샵
인천출장샵
횡성출장샵
세종출장샵
Their trained professionals better know how to car battery jump service
ReplyDelete부천콜걸
ReplyDelete화성콜걸
안산콜걸
안양콜걸
평택콜걸
시흥콜걸
김포콜걸
경기광주콜걸
We’ll also investigate the broader implications of regression beyond individual experiences. How does it influence our relationships, decision-making, and overall mental health? What role does it play in shaping cultural and social phenomena? By examining these questions, we aim to provide a comprehensive understanding of how regression impacts not just individuals, but society as a whole.
ReplyDeletedui lawyer rockbridge va
Your posts always give me fresh insights. This one was no exception! I’m already looking forward to your next article.
ReplyDelete